View all blogs
What 72,000 filings reveal about the 2026 insurance market so far
Market insights

By
Insuraviews
August 25, 2026

If you only watched headline rate averages this year, you might conclude the P&C market has gone quiet. The filing record says otherwise. Through August 13, carriers have submitted 71,992 distinct filings across 51 jurisdictions, from 786 carrier groups, spanning 61 lines of business. The premium-weighted average rate impact across filings with usable rate and premium data sits at just 0.91%.
That average is doing a lot of hiding. Underneath it, lines of business are moving in sharply different directions, form and rule activity is outpacing pure rate work, and major carriers are pursuing visibly different strategies inside the same market. Here is what the mid-year 2026 filing data actually shows, and what it means for your second half.
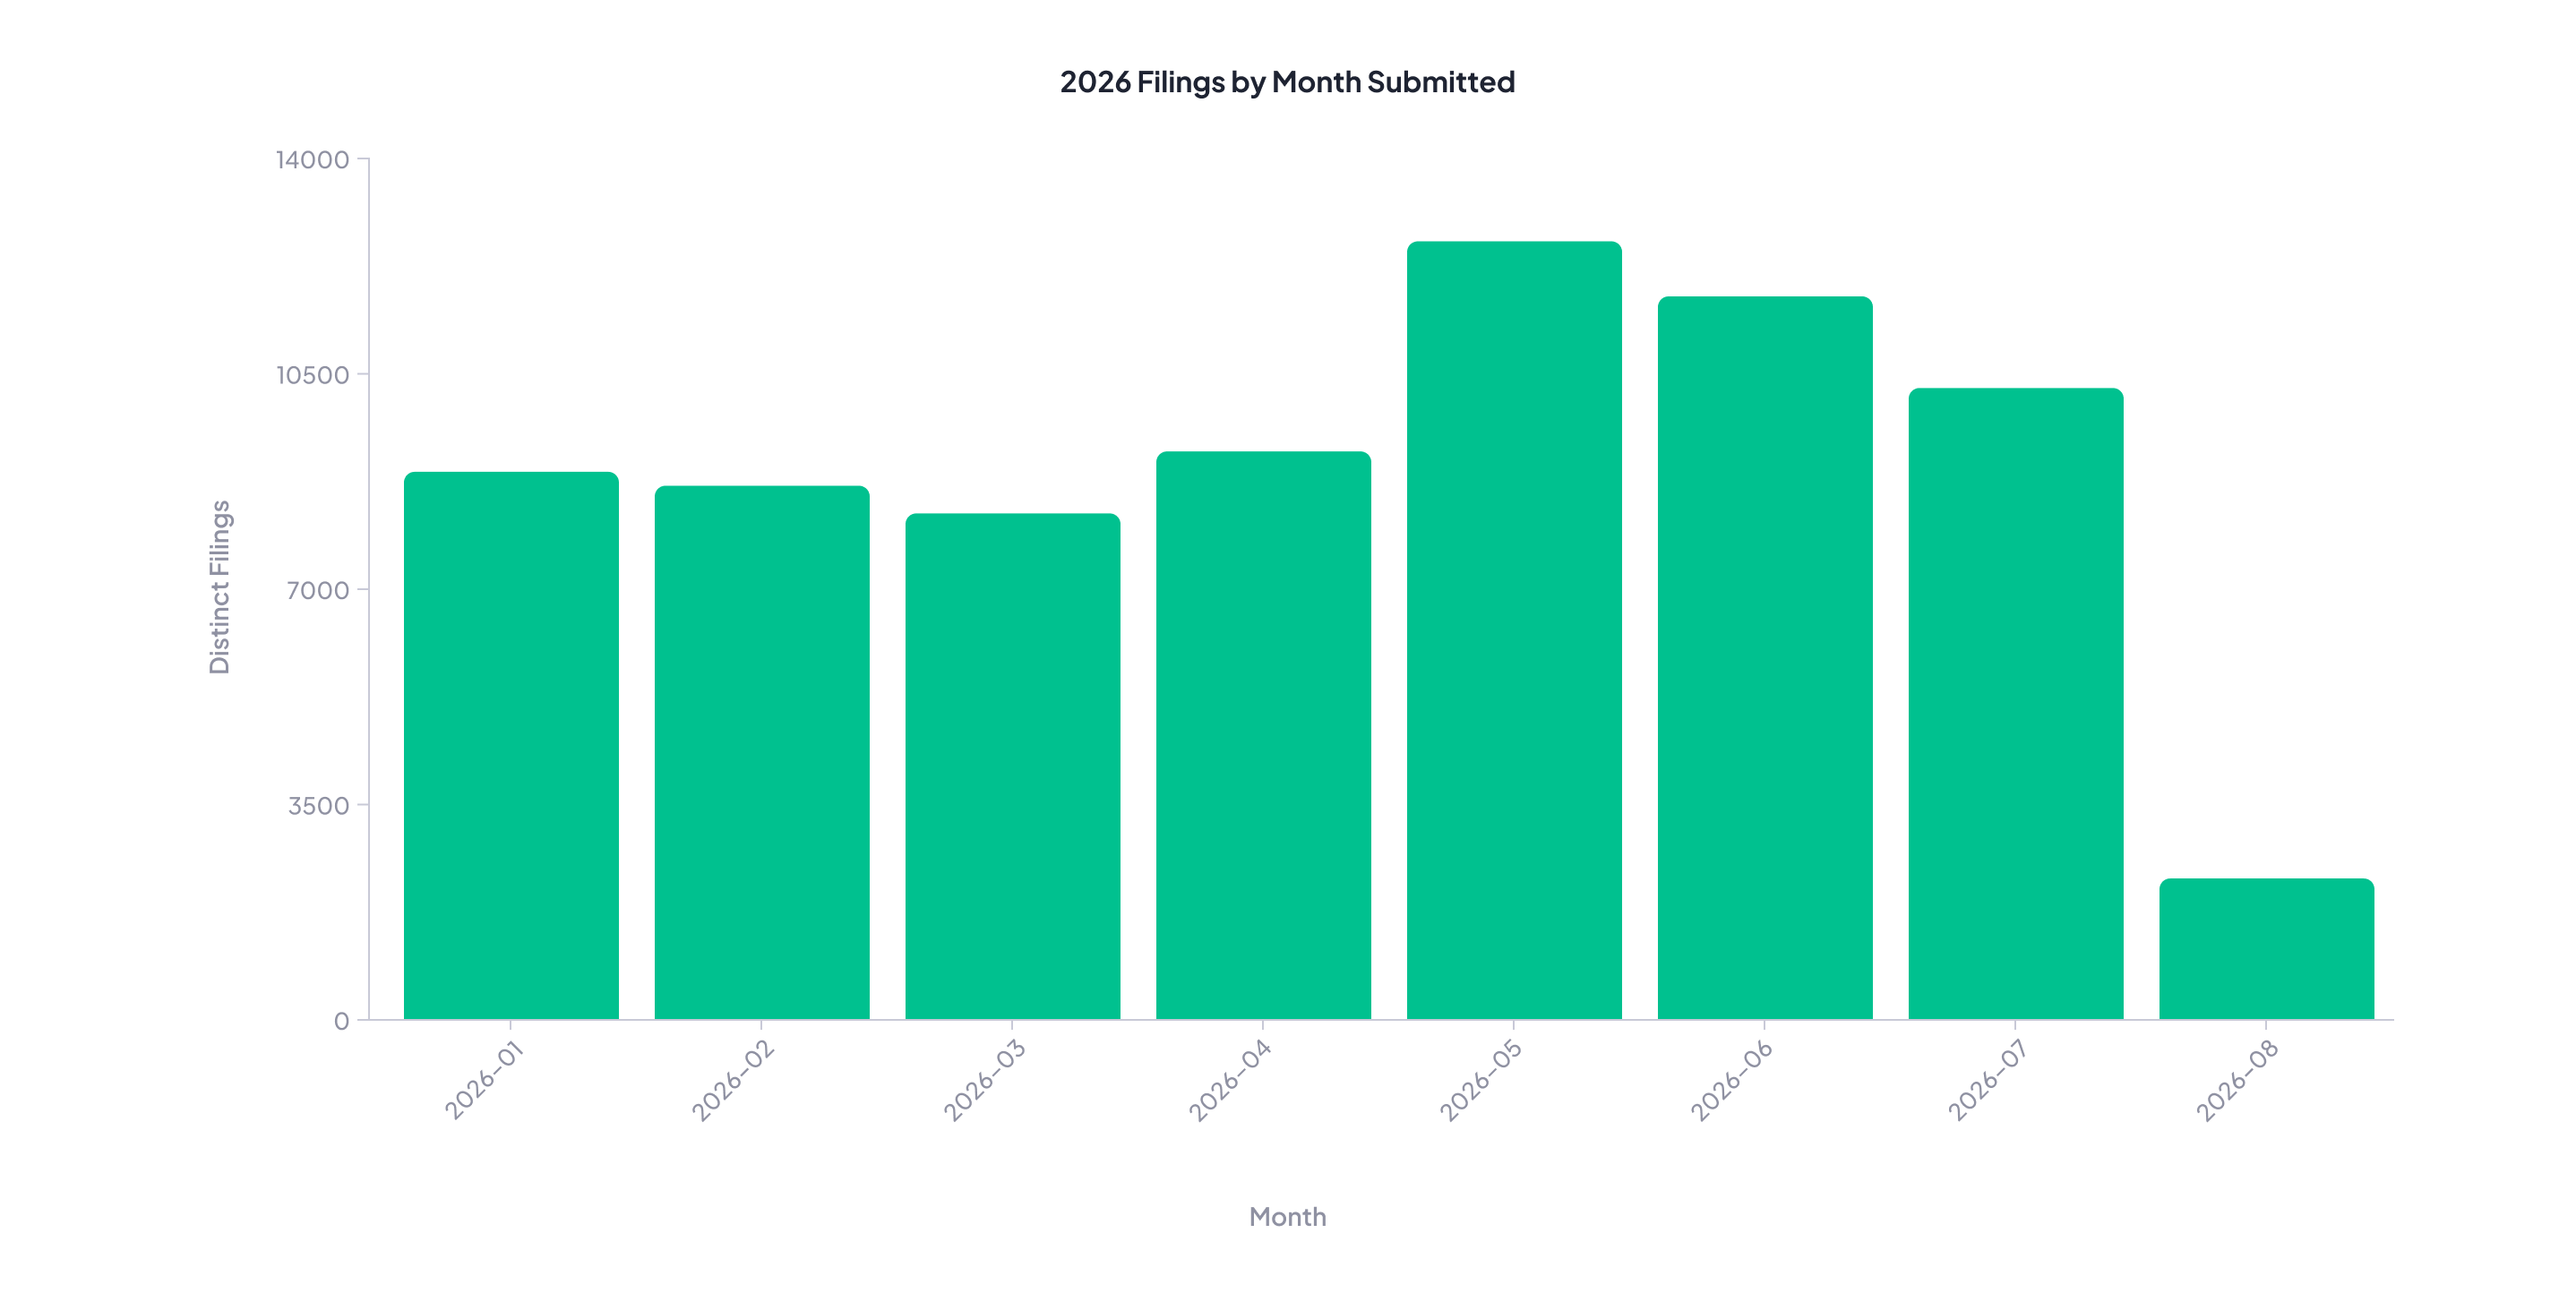
The pipeline has stayed busy all year, with a clear surge in the second quarter. Monthly submission counts climbed from 8,904 in January to a peak of 12,633 in May, held strong at 11,755 in June, and moderated to 10,280 in July. Even with August incomplete, 2026 is on pace for another high-volume year.
High volume matters because it rarely means one thing. It means carriers are responding to loss trends, refining product design, revisiting underwriting rules, and recalibrating state-by-state strategy all at once. If your team reviews filings by hand, that pace is a workload problem. Averaging roughly 148 pages per filing, the 2026 pipeline represents millions of pages of rate manuals, actuarial memoranda, and supporting exhibits.
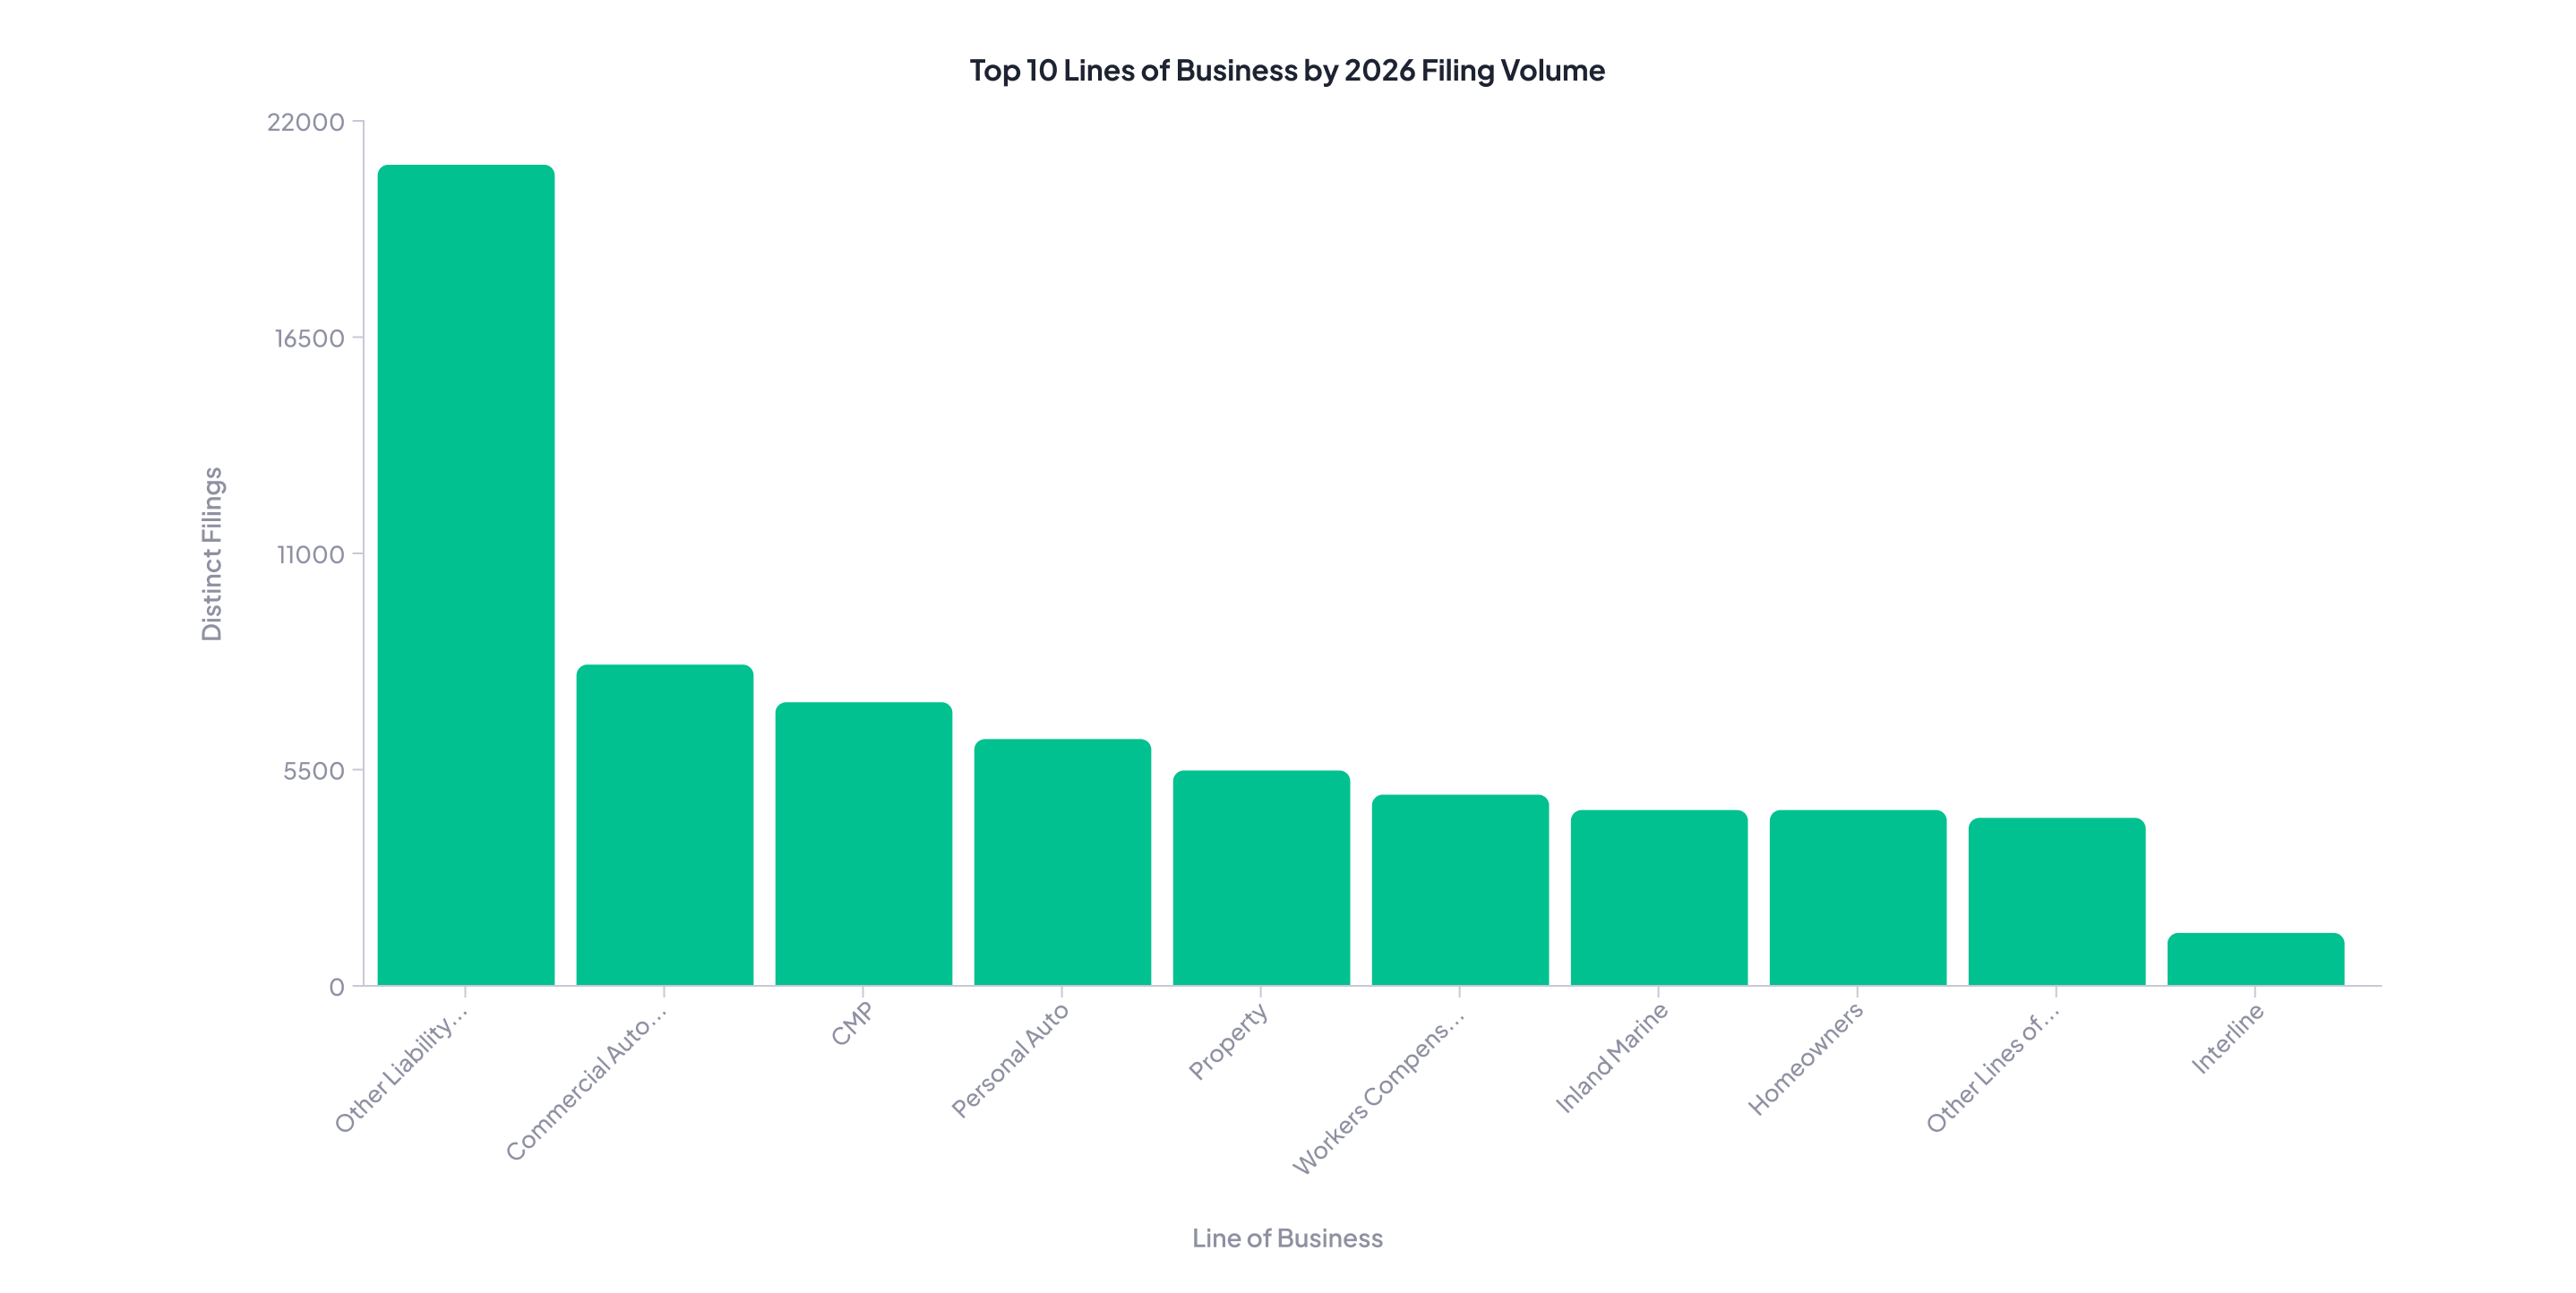
Industry attention tends to gravitate toward personal auto and homeowners, but the 2026 filing count tells a different story. Other Liability leads all lines with 20,951 filings, followed by Commercial Auto at 8,160 and CMP at 7,186. Personal Auto (6,236) and Homeowners (4,425) remain major categories, but they are not driving the volume.
That mix signals carriers actively adjusting commercial books: responding to claim severity, litigation exposure, and class segmentation. If your competitive intelligence work is focused mainly on personal lines, the busiest part of the 2026 market may be happening outside your field of view.
The filing type mix is one of the most telling numbers in the dataset. Form filings lead at 32,550, more than the Rate/Rule (12,680), Rule (7,912), and Rate (5,571) categories combined. Carriers are not just repricing. They are rewriting coverage wording, endorsements, eligibility criteria, and underwriting rules at scale.
For anyone tracking the market, this is the practical takeaway: if you only monitor filed rate changes, you are missing a large share of what is actually moving. Form and rule filings often reveal where carriers are tightening terms, refining segmentation, or laying groundwork for future pricing moves, months before those moves show up as a rate action.
The 0.91% premium-weighted average masks real divergence across major lines:
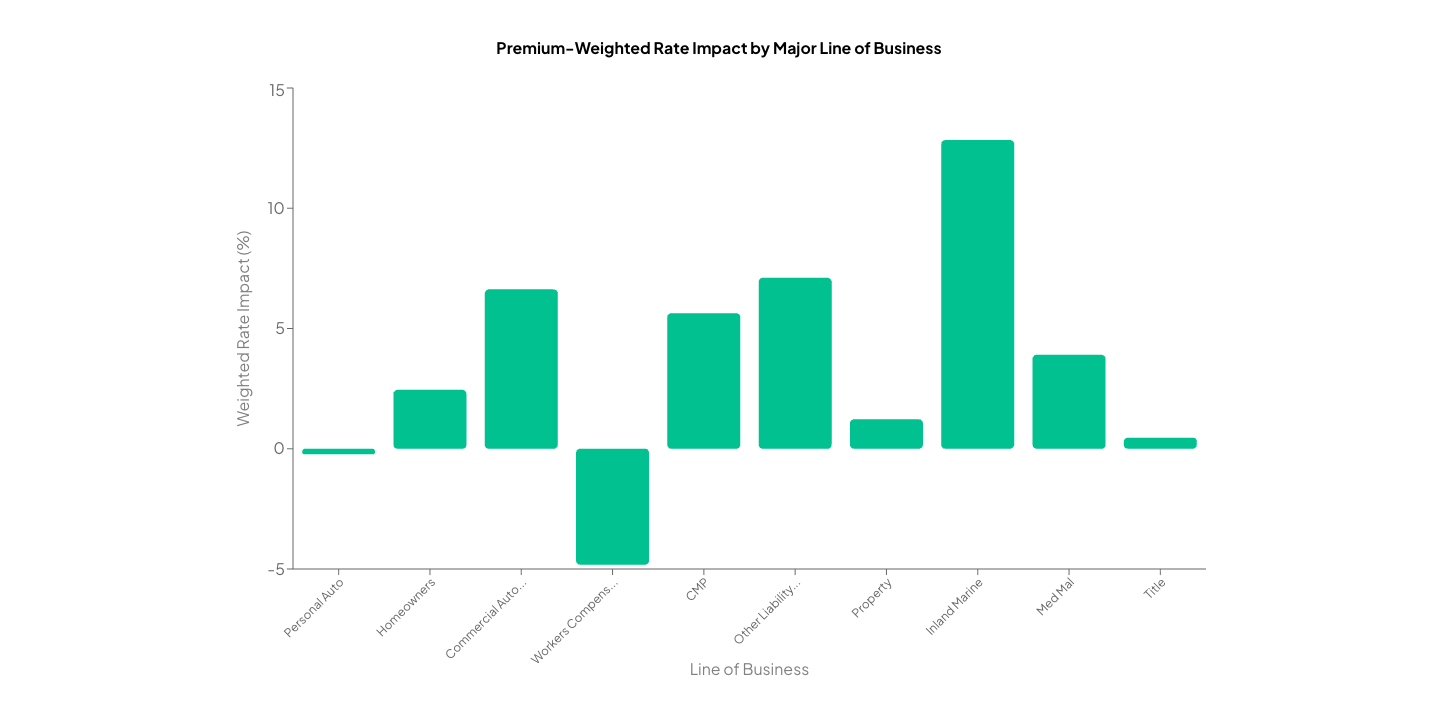
Personal auto appears to be stabilizing. A slightly negative weighted impact suggests the steep upward pressure of prior years is no longer dominating the filing record, and that competitive dynamics are re-emerging as pricing adequacy improves.
Homeowners is still moving up, but at 2.45% the pace is more moderate than the sharpest recent property corrections. Expect pressure to surface through eligibility changes, coverage refinements, and targeted state actions rather than sweeping base rate increases.
Commercial auto, CMP, and liability remain under real upward pressure. For many carriers, 2026 still looks like a year of margin repair and portfolio refinement in liability-oriented books.
Workers compensation remains clearly soft at -4.82%, consistent with a line where profitability and loss development continue to support downward pricing.
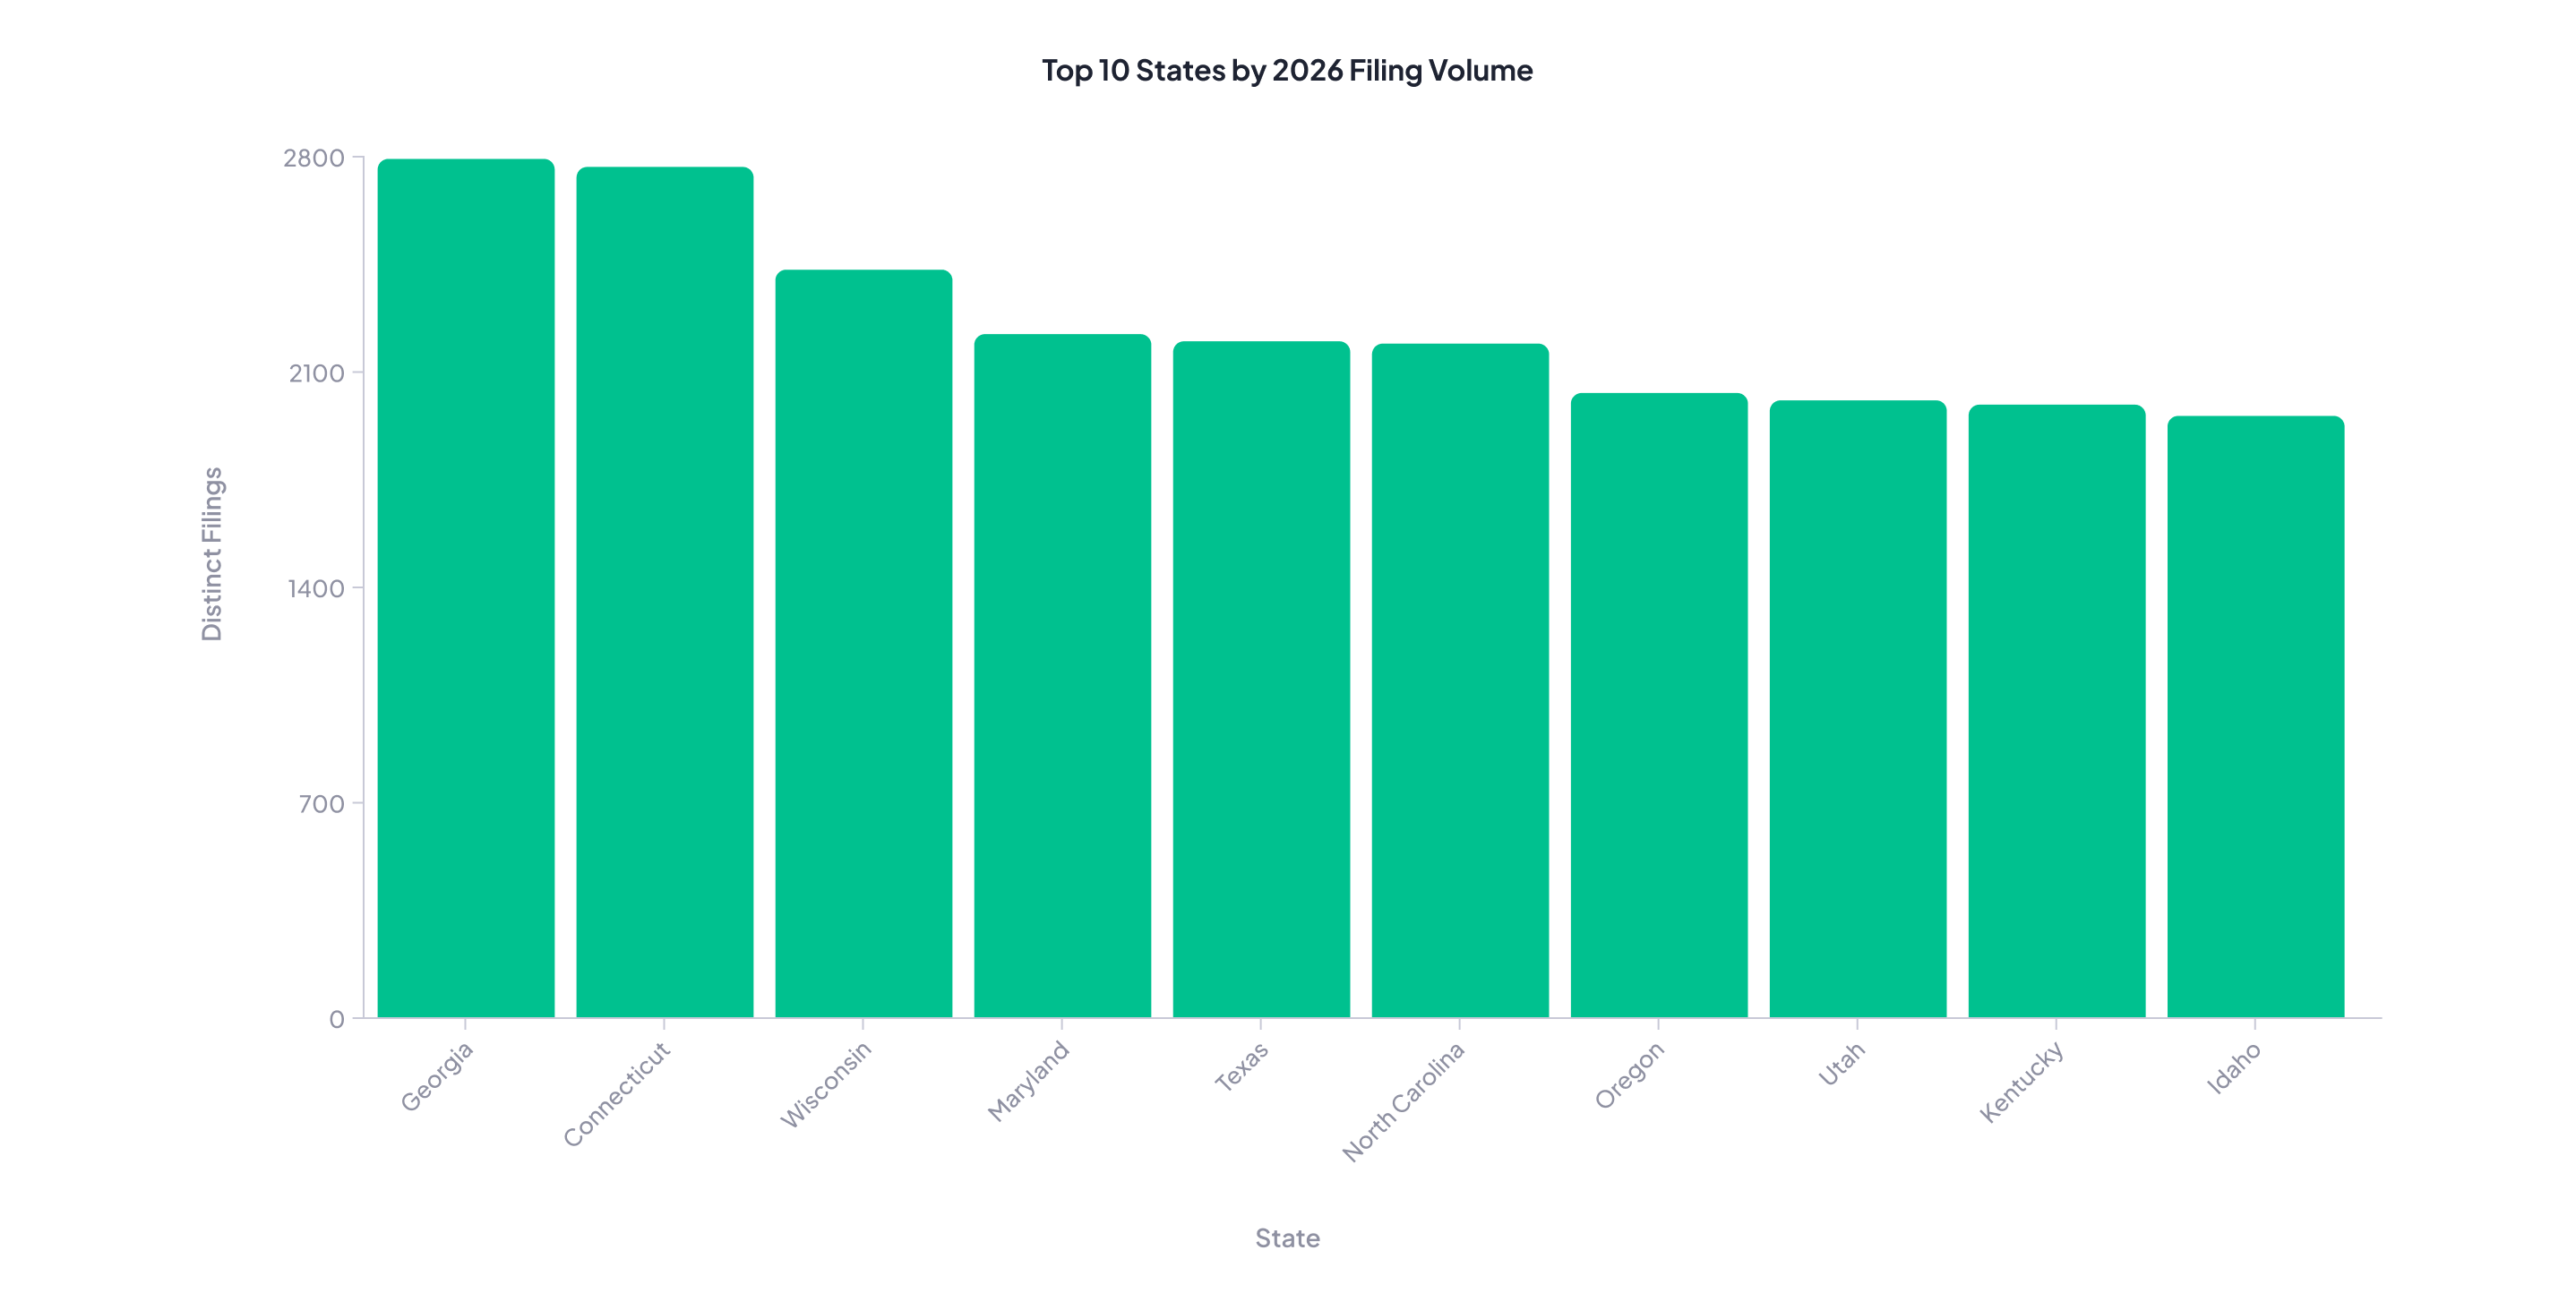
Filing volume is not concentrated in the biggest premium states. Georgia (2,798), Connecticut (2,769), and Wisconsin (2,435) lead the count, with Maryland, Texas, North Carolina, Oregon, Utah, Kentucky, and Idaho close behind. Several mid-sized regulatory markets are extremely active, which makes them useful bellwethers if you know to watch them.
Carrier behavior is diverging too. Among large premium carriers with at least 10 filings and usable rate data, weighted rate impacts range from Progressive at -0.44% to Farmers at 3.09%, with State Farm (0.35%), Travelers (0.48%), Allstate (1.49%), USAA (2.20%), and Liberty Mutual (2.65%) spread across the middle. A simple "the market is up" or "the market is down" narrative no longer holds. The real story is strategic divergence, and it is visible filing by filing.
Four questions worth tracking through December:
Every trend in this post came out of the filing record itself. The challenge is that the record is enormous: tens of thousands of filings, each averaging around 148 pages of rate manuals, actuarial memoranda, and exhibits. The carriers that spot divergence early are the ones that can get from question to answer without reading all of it.
That is the work Insuraviews is built for. Ask the AI Assistant which carriers are moving rates in your line and states, pull the rating algorithm or class code schedule from a competitor's latest manual, or reconstruct a multi-tier factor exhibit into a usable table. A 20 minute filing review becomes a 2 minute one, and the time you save goes toward acting on what you find.
Log in and give it a try, and as always, let us know what you'd like to see next.
Not yet a customer? Schedule a demo of Insuraviews today to see what you're missing.


© 2026 Insuraviews. All rights reserved.
.png)